Tasks down the left, time across the top, a bar for each activity where it belongs in the calendar. We call it a Gantt chart. Henry Gantt made it famous in the First World War. He did not invent it, and he was not close to first.
1765Priestley drew time as distance
A century and a half early, the chemist Joseph Priestley made one inch of paper equal a fixed span of years and drew each life or empire as a band. Duration became length, position carried date, and the eye could compare two thousand spans without arithmetic. That is the whole trick of the Gantt chart, complete.

1896Adamiecki built the working schedule
Priestley charted the past. Scheduling the future of work belongs to Karol Adamiecki, who around 1896 built the harmonogram to run Polish steel mills, fifteen years before Gantt. He published in Polish and Russian, late, in journals no Western engineer read.
_(cropped).jpg)
The harmonogram was arguably more advanced than Gantt's charts. It lost the naming war anyway. Wikimedia Commons, PD.
1919Gantt made it famous
Gantt's contribution was real, if narrower than the name suggests: he folded plan and progress onto the same line. His charts ran the arsenals and shipyards of the war, then the Hoover Dam and the Boeing B-29. Below is the genuine article, a load chart from Wallace Clark's 1922 book that carried the method worldwide.
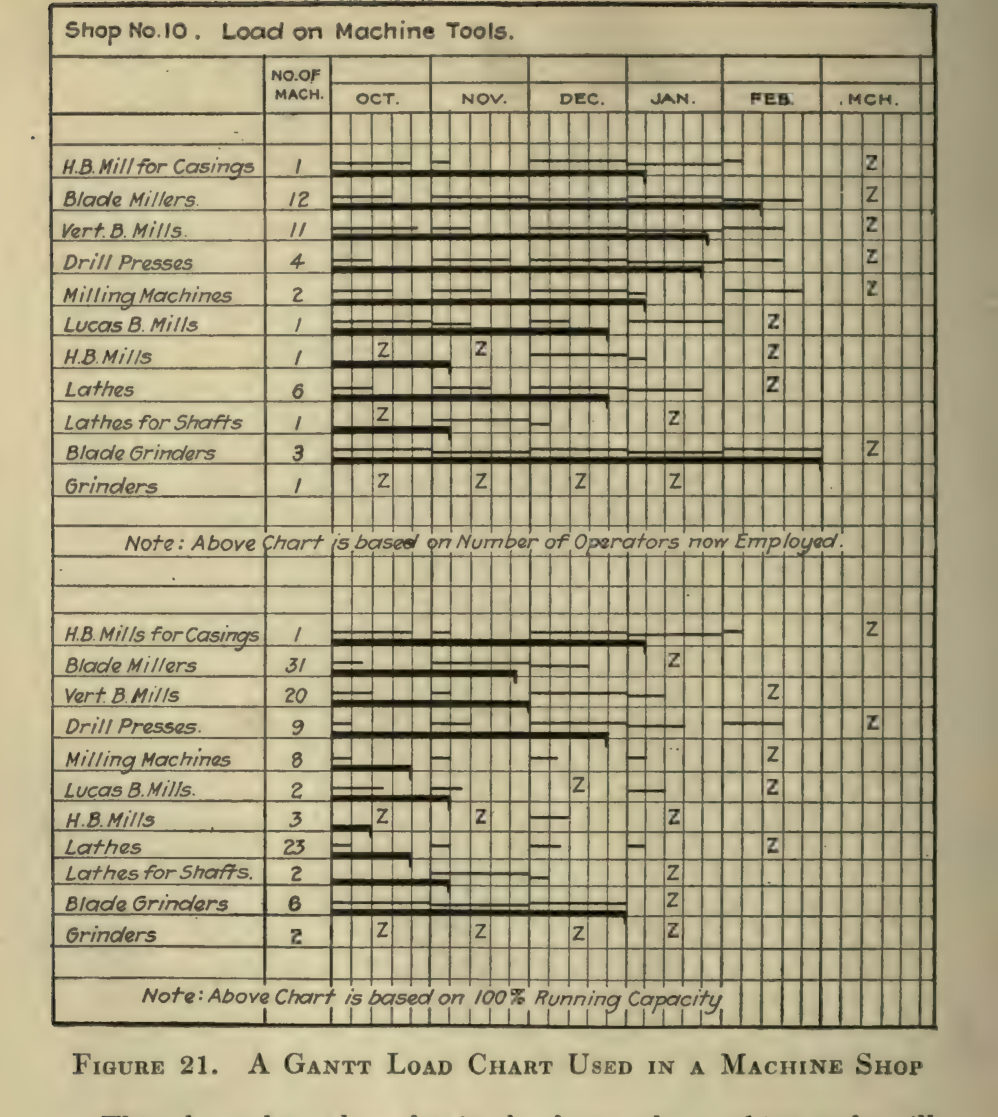

Wrote in English, beside the loudest management movement of the age, in a war economy that needed exactly this tool. Wikimedia Commons, PD.
·Plan and progress, one line
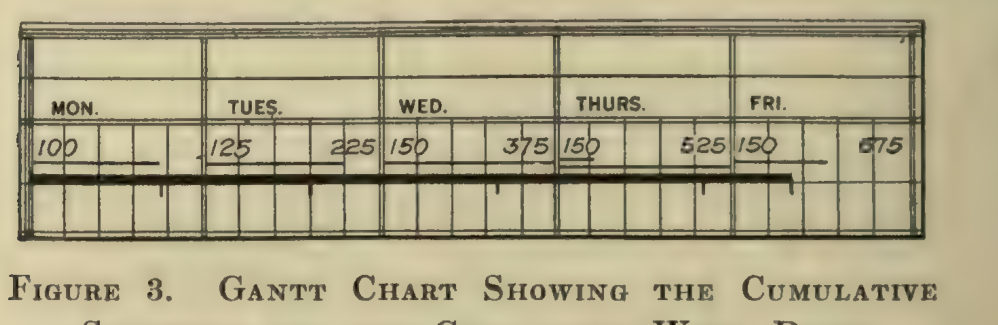
His one durable idea, drawn in his own hand: the light line is the schedule, the heavy line is the work done. When the heavy line trails the light one, the shop is behind, and you see it without reading a number.
Now drive it. Drag today across the week, and watch each machine declare itself ahead or behind, the way a foreman reads it in a glance.
A planning artifact only counts when the person deciding can read it without translation.
The whole lessonAdamiecki's harmonogram was arguably better. It lost anyway, because the chart that spread was not the earliest or the best. It was the one that reached the room where the work was done. That is still the test. A modern Primavera schedule holds more logic than any of these men could have dreamed, and most of it never reaches a decision-maker, because the output is a wall of a thousand bars nobody reads. The next two pieces pick that apart.